Drug
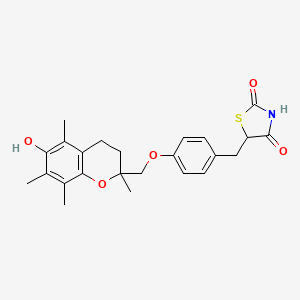
D0124 | Troglitazone
A
A10BG01 Troglitazone
[A10BG] Thiazolidinediones
[A10B] BLOOD GLUCOSE LOWERING DRUGS, EXCL. INSULINS
[A10] DRUGS USED IN DIABETES
[A] Alimentary tract and metabolism
| Toxicity | Dose | Time | Species | Model | Method | Action | Positive criterion | Reference |
|---|---|---|---|---|---|---|---|---|
| TRANSMEMBRANE POTENTIAL | 10–50 μM | 3min | male CD-1 mice | isolated liver mitochondria | The electrical transmembrane potential of mitochondria was monitored spectrophotometrically with the cationic dye, rhodamine 123, and monitored at the 505/535 nm. | decrease | p < 0.05, significantly different from the control | 331 |
| TRANSMEMBRANE POTENTIAL | 10-50 µM | ZDF fa/fa rat & ZDF lean rat | isolated liver mitochondria | The transmembrane potential of the mitochondria was monitored spectrophotometrically using rhodamine-123. | decrease | significantly different from control group (p < 0.05) | 225 | |
| TRANSMEMBRANE POTENTIAL | >25 µM | 30min | HepG2 cells | JC1 | decrease | 332 | ||
| TRANSMEMBRANE POTENTIAL | 100 µM | 5min | HepG2 cells | Tetramethylrhodamine methyl ester (TMRE) | decrease | 330 | ||
| TRANSMEMBRANE POTENTIAL | 61.9 µM | 3hr | HepG2 cells | stained with a Mitotracker red dye, and then fixed with paraformaldehyde | decrease | IC50 | 330 | |
| OPENING OF PERMEABILITY TRANSITION PORE (PTP) | increase | 35 | ||||||
| OPENING OF PERMEABILITY TRANSITION PORE (PTP) | increase | 7 | ||||||
| OPENING OF PERMEABILITY TRANSITION PORE (PTP) | 10 µM | 6hr | type 2 diabetes mellitus model rat | primary hepatocytes or isolated mitochondria | The loss of mitochondrial calcein and Hoechst 33342 nuclear fluorescence using a fluorescence microscope as an indicator of MPT for rat primary hepatocyte . Mitochondrial swelling as an indicator of MPT for isolated mitochondria. | 225 | ||
| OPENING OF PERMEABILITY TRANSITION PORE (PTP) | 5 µM | 1 hour | Human | HepG2 | High-content screening assay | Decrease | MEC | 306 |
| OPENING OF PERMEABILITY TRANSITION PORE (PTP) | 10–75 μM | male CD-1 mice | isolated liver mitochondria | Mitochondrial swelling as the indicator of mitochondrial permeability transition (MPT) was estimated from the decrease in absorbance at 540 nm. | induce | 331 | ||
| OPENING OF PERMEABILITY TRANSITION PORE (PTP) | 10 µM | 6hr | ZDF fa/fa rat vs ZDF lean rat | hepatocytes | Co2+-calcein assays; MPT pore opening was determined by measuring intensity of calcein fluorescence in the mitochondria quenched by cobalt and normalizing cell number of hoechst33342. | induce | significantly different from ZDF lean rats (p < 0.05) | 225 |
| MEMBRANE POTENTIAL | 3.4 µM | 30 mins | mouse | liver mitochondria | Rh123 fluorescence (excitation 485 nm, emission 535 nm) are recorded using a fluorescence multi-well plate reader (mCICCP (20 µM) treatments was considered as the 100% baseline for ΔΨm loss) | decrease | EC20 | 36 |
| MEMBRANE POTENTIAL | 10 µM | 1 hour | Human | HepG2 | High-content screening assay | Decrease | MEC | 306 |
| RESPIRATION | 3.9 µM | 60 mins | mouse | liver mitochondria | Oxygen consumption was monitored with 50nM MitoXpress ( an oxygen-sensitive phosphorescent dye) using a spectrofluorimeter (Tecan Infinite 200; λExcitation 380nm; λEmission 650nm). Rotenone (2µM) was used as 100% baseline for complex I inhibition. | decrease | EC20 | 36 |
| RESPIRATION | 6 µM | 60 mins | mouse | liver mitochondria | Oxygen consumption was monitored with 50nM MitoXpress ( an oxygen-sensitive phosphorescent dye) using a spectrofluorimeter (Tecan Infinite 200; λExcitation 380nm; λEmission 650nm). Oligomycin A (1µM) was used as 100% baseline for complex II inhibition. | decrease | EC20 | 36 |
| RESPIRATORY CONTROL RATIO (RCR) | 10-50 μM | ZDF fa/fa rat & ZDF lean rat | isolated liver mitochondria | OCR and measured using a fluorescent oxygen probe (Presens) | decrease | significantly different from control (p < 0.05) | 225 | |
| RESPIRATORY CONTROL RATIO (RCR) | 10-50 μM | ZDF fa/fa rat & ZDF lean rat | isolated liver mitochondria | OCR and measured using a fluorescent oxygen probe (Presens) | Negative | 225 | ||
| OXYGEN CONSUMPTION RATE (OCR) | > 100 μM | 2 minutes | human | HepG2 | Measurement of ECAR | decrease | EC50 | 7 |
| OXYGEN CONSUMPTION RATE (OCR) | 10 μM | 2 minutes | feline | cardiomyocytes | Measurement of OCR | increase | EC50 | 7 |
| ELECTRON TRANSPORT CHAIN | decrease | 35 | ||||||
| ELECTRON TRANSPORT CHAIN | decrease | 7 | ||||||
| ELECTRON TRANSPORT CHAIN | inhibit | 197 | ||||||
| ECAR | > 100 μM | 2 minutes | human | HepG2 | Measurement of ECAR | increase | EC50 | 7 |
| ECAR | 10 μM | 2 minutes | feline | cardiomyocytes | Measurement of ECAR | increase | EC50 | 7 |
| GLUCOSE GALACTOSE IC50 RATIO | 300.0 ± 0, 300.0 ± 0, 1, 300.0 ± 0, 300.0 ± 0, 1 | 4hr | H9c2 cells | high-glucose–galactose cell viability assay with JC-1 mitochondrial membrane potential and ATP-depletion assays (CellTiter-Glo reagent ). | Negative | glucose/galactose IC50 ratio (JC-1 IC50 in glucose, JC-1 IC50 in galactose, JC-1 glu/gla, ATP IC50 in glucose, ATP IC50 in galactose, ATP glu/gla ) | 50 | |
| GLUCOSE GALACTOSE IC50 RATIO | 300.00 ± 0 , 1.4 ± 0.1, 219.8, 300.0 ± 0, 1.9 ± 0.1, 156.7 | 24hr | H9c2 cells | high-glucose–galactose cell viability assay with JC-1 mitochondrial membrane potential and ATP-depletion assays (CellTiter-Glo reagent ). | glucose/galactose IC50 ratio (JC-1 IC50 in glucose, JC-1 IC50 in galactose, JC-1 glu/gla, ATP IC50 in glucose, ATP IC50 in galactose, ATP glu/gla ) | 50 | ||
| MITOCHONDRIAL FATTY ACID BETA OXIDATION | affect | 227 | ||||||
| LIPID PEROXIDATION | 10 µM | ZDF fa/fa rat vs ZDF lean rat | isolated mitochondria and liver homogenates | lipid peroxidation was measured from thiobarbituric acid-reactive substances (TBARS) formation at 480-570 nm. | Negative | 225 | ||
| PHOSPHOLIPID METABOLISM | 10 µM | ZDF fa/fa rat vs ZDF lean rat | isolated mitochondria | Oxidation of mitochondrial phospholipids was measured by HPLC analysis. Peak area ratio (235/206 nm) shows relative peroxidative phospholipid content. Peak areas at 206 nm and 235 nm analyze non-peroxidative and peroxidative phospholipid. | peroxidation | significantly different from ZDF lean rats (p < 0.05) | 225 | |
| ACCUMULATION OF CALCIUM | 50 μM | male CD-1 mice | isolated liver mitochondria | Assessment of mitochondrial Ca2+ efflux with arsenazo III at 675/685 nm. | decrease | 331 | ||
| ATP LEVEL | human | hepatocytes | ATP bioluminescence assay | decrease | 226 | |||
| ATP LEVEL | >25 µM | 1 and 2 hr | HepG2 cells | Cellular ATP concentrations were measured with a ATP Bioluminescent Somatic Cell Assay Kit | decrease | 332 | ||
| GSH CONTENT | 10 µM | ZDF fa/fa rat vs ZDF lean rat | isolated mitochondria | Measurement of reduced/oxidized glutathione (GSH/GSSG): the reduced/oxidized glutathione (GSH/GSSG) concentration of the samples was determined from a standard curve using the enzymatic method and a Multiskan JX system. | lower | significantly different from ZDF lean rats (p < 0.05). | 225 | |
| GSH CONTENT | 10 µM | ZDF fa/fa rat vs ZDF lean rat | liver homogenate | Measurement of reduced/oxidized glutathione (GSH/GSSG): the reduced/oxidized glutathione (GSH/GSSG) concentration of the samples was determined from a standard curve using the enzymatic method and a Multiskan JX system. | Negative | 225 | ||
| SWELLING | > 200 µM | 30 mins | mouse | liver mitochondria | swelling assay: Absorbance at 545 nm using a fluorescence multi-well plate reader (CaCl2 (50 µM) was considered as the 100% baseline for the swelling ) | increase | EC20 | 36 |
| SWELLING | 10 µM | ZDF fa/fa rat vs ZDF lean rat | isolated liver mitochondria | Mitochondrial swelling as an indicator of MPT was determined by the decrease in absorbance at 540 nm on a UV-2550 spectrophotometer. | induce | significantly different from ZDF lean rats (p < 0.05) | 225 | |
| SWELLING | 10 µM | Wistar rat | Isolated rat liver mitochondria | Measurement of MPT using vesicle-fused mitochondria ( isolated mitochondria were preincubated with micellized phospholipid containing CL or CLOOH,and then a swelling assay was performed. ) | increase | 225 | ||
| SWELLING | 25 µM | HepG2 cells | confocal laser scanning microscopy (MitoTracker Red) | 332 | ||||
| FORMATION AND MAINTENANCE OF CRISTAE STRUCTURE | 25 µM | HepG2 cells | Images from transmission electron microscopy | abnormal | 332 | |||
| OXIDATIVE STRESS | human | hepatocytes | cell viability assay | 226 | ||||
| ROS PRODUCTION | 10 µM | 1 hour | Human | HepG2 | High-content screening assay | Increase | MEC | 306 |
| MITOCHONDRIAL DNA | human | hepatocytes | Assay for mtDNA damage: MtDNA damage was assessed as the diminished intensity in the 16.5 kb restriction band, as compared to control bands. | damage | 226 | |||
| APOPTOSIS | human | hepatocytes | cell viability assay | induce | 226 | |||
| CASPASE ACTIVITY | 100 µM | 24hr | HepG2 cells | Apo-One homogeneous caspase 3 assay kit | 330 | |||
| Target | Dose | Time | Species | Model | Method | Action | Positive criterion | Reference |
|---|---|---|---|---|---|---|---|---|
| NADH:ubiquinone reductase | 3.9 µM | 60 mins | mouse | liver mitochondria | Oxygen consumption was monitored with 50nM MitoXpress ( an oxygen-sensitive phosphorescent dye) using a spectrofluorimeter (Tecan Infinite 200; λExcitation 380nm; λEmission 650nm). Rotenone (2µM) was used as 100% baseline for complex I inhibition. | inhibit | EC20 | 36 |
| Succinate dehydrogenase | 6 µM | 60 mins | mouse | liver mitochondria | Oxygen consumption was monitored with 50nM MitoXpress ( an oxygen-sensitive phosphorescent dye) using a spectrofluorimeter (Tecan Infinite 200; λExcitation 380nm; λEmission 650nm). Oligomycin A (1µM) was used as 100% baseline for complex II inhibition. | inhibit | EC20 | 36 |
| Long-chain-fatty-acid--CoA ligase | not specified | 227 | ||||||
| Reactive oxygen species | 10 µM | 1 hour | Human | HepG2 | High-content screening assay | increase | MEC | 306 |
| Cytochrome c | > 400 µM | 30 mins | mouse | liver mitochondria | Cytochrome c release was evaluated using ELISA kit ( 20 µg/ml Alamethicin was used as 100% baseline) | release | EC20 | 36 |
| Caspase-3 | 100 µM | 24hr | HepG2 cells | Apo-One homogeneous caspase 3 assay kit | activation | 330 | ||
| (+-)-all-rac-5-(p-((6-Hydroxy-2,5,7,8-tetramethyl-2-chromanyl)methoxy)benzyl)-2,4-thiazolidinedione | (+/-)-5-[4-[(6-hydroxy-2,5,7,8-tetramethylchroman-2-yl)methoxy]benzyl]-2,4-thiazolidinedione | (5R)-5-[[4-[[(2S)-6-hydroxy-2,5,7,8-tetramethyl-chroman-2-yl]methoxy]phenyl]methyl]thiazolidine-2,4-dione |
| 18524-EP2269989A1 | 18524-EP2270011A1 | 18524-EP2272825A2 |
| 18524-EP2272841A1 | 18524-EP2275414A1 | 18524-EP2295409A1 |
| 18524-EP2298742A1 | 18524-EP2301936A1 | 18524-EP2305219A1 |
| 18524-EP2305648A1 | 18524-EP2308847A1 | 18524-EP2314576A1 |
| 18524-EP2314588A1 | 2,4-Thiazolidinedione, 5-((4-((3,4-dihydro-6-hydroxy-2,5,7,8-tetramethyl-2H-1-benzopyran-2-yl)methoxy)phenyl)methyl)- | 2,4-Thiazolidinedione, 5-[[4-[(3,4-dihydro-6-hydroxy-2,5,7,8-tetramethyl-2H-1-benzopyran-2-yl)methoxy]phenyl]methyl]- (9CI) |
| 2,4-thiazolidinedione, 5-[[4-[(3,4-dihydro-6-hydroxy-2,5,7,8-tetramethyl-2H-1-benzopyran-2-yl)methoxy]phenyl]methyl]- | 322T877 | 5-(4-((6-hydroxy-2,5,7,8-tetramethylchroman-2-yl)methoxy)benzyl)thiazolidine-2,4-dione |
| 5-(4-((6-hydroxy-2,5,7,8-tetramethylchroman-2-yl-methoxy)benzyl)-2,4-thiazolidinedione) | 5-(4-(6-Hydroxy-2,5,7,8-tetramethylchroman-2-ylmethoxy)benzyl)thiazolidine-2,4-dione | 5-[(4-{[(6-hydroxy-2,5,7,8-tetramethyl-3,4-dihydro-2H-chromen-2-yl)methyl]oxy}phenyl)methyl]-1,3-thiazolidine-2,4-dione |
| 5-[4-(6-Hydroxy-2,5,7,8-tetramethyl-3,4-dihydro-2H-1-benzopyran-2-ylmethoxy)benzyl]thiazolidine-2,4-dione | 5-[4-(6-hydroxy-2,5,7,8-tetramethylchroman-2-ylmethoxy)benzyl]-2,4-dioxothiazolidine | 5-[4-(6-hydroxy-2,5,7,8-tetramethylchroman-2-ylmethoxy)benzyl]thiazolidine -2,4-dione |
| 5-[4-(6-hydroxy-2,5,7,8-tetramethylchroman-2-ylmethoxy)benzyl]thiazolidine-2,4-dione | 5-[[4-[(3,4-Dihydro-6-hydroxy-2,5,7,8-tetramethyl-2H-1- benzopyran-2-yl)methoxy]phenyl]methyl]-2,4-thiazlidinedione | 5-[[4-[(3,4-Dihydro-6-hydroxy-2,5,7,8-tetramethyl-2H-1-benzopyran-2-yl)methoxy]phenyl]methyl]-2,4-thiazolidinedione |
| 5-[[4-[(6-hydroxy-2,5,7,8-tetramethyl-3,4-dihydrochromen-2-yl)methoxy]phenyl]methyl]-1,3-thiazolidine-2,4-dione | 5-[[4-[(6-hydroxy-2,5,7,8-tetramethylchroman-2-yl)methoxy]phenyl]methyl]-1,3-thiazolidine-2,4-dione | 5-{4-(6-hydroxy-2, 5, 7, 8-tetramethylchroman-2-yl-methoxy) benzyl) thiazolidine-2,4-dione |
| 5-{4-[(6-hydroxy-2,5,7,8-tetramethyl-3,4-dihydro-2H-chromen-2-yl)methoxy]benzyl}-1,3-thiazolidine-2,4-dione | 5-{4-[(6-hydroxy-2,5,7,8-tetramethyl-3,4-dihydro-2h-chromen-2-yl)methoxy]benzyl}-1,3-thiazolidin-2,4-dion | 97322-87-7 |
| AB00643330-02 | AB0125513 | AK307955 |
| AKOS000281116 | AKOS024457434 | API0004529 |
| AS-56378 | BCP06753 | BDBM50088494 |
| BDBM50101974 | BG0468 | BRD-A13084692-001-02-5 |
| BRN 4338399 | C-22371 | C24H27NO5S |
| CAS-97322-87-7 | CC-35518 | CCG-208125 |
| CCRIS 8969 | CHEBI:9753 | CHEMBL3542292 |
| CI 991 | CI-991 | CS 045 |
| CS-045 | CS-1634 | CS045 |
| CTK7H5564 | D00395 | DB-057670 |
| DB00197 | DSSTox_CID_3719 | DSSTox_GSID_23719 |
| DSSTox_RID_77162 | DTXSID8023719 | FT-0630994 |
| GP8940 | GR 92132X | GR-92132X |
| GR92132X | GTPL2693 | GXPHKUHSUJUWKP-UHFFFAOYSA-N |
| HMS2089D22 | HMS2093D04 | HMS3649G12 |
| HMS3713D08 | HSCI1_000037 | HY-50935 |
| K752 | KS-00001DVG | LS-151313 |
| MLS006010817 | NCGC00161599-01 | NCGC00161599-02 |
| NCGC00161599-03 | NCGC00161599-04 | NCGC00161599-05 |
| NCGC00161599-06 | NCGC00161599-07 | NCGC00161599-08 |
| NCGC00161599-09 | NCGC00161599-11 | NCGC00164445-01 |
| NCGC00254440-01 | Noscal | Prelay |
| Q7844989 | Rezulin | Rezulin (TN) |
| Romglizone | Romozin | SC-46000 |
| SCHEMBL4959 | SMP2_000224 | SMR001550129 |
| SR-05000000454 | SR-05000000454-2 | SR-05000000454-3 |
| SR-05000000454-5 | Spectrum5_001973 | Tox21_112119 |
| Tox21_112119_1 | Tox21_300470 | Troglitazone (CS-045) |
| Troglitazone (JAN/USAN/INN) | Troglitazone [USAN:BAN:INN] | Troglitazone [USAN:INN:BAN] |
| Troglitazone, >=98% (HPLC) | UPCMLD-DP017 | UPCMLD-DP017:001 |
| UPCMLD-DP017:002 | VA11909 | s8432 |
| troglitazona | troglitazone | troglitazonum |
| DrugBank Name | Troglitazone |
| DrugBank | DB00197 |
| CAS Number | 97322-87-7 |
| PubChem Compound | 5591 |
| KEGG Drug | D00395 |
| PubChem.Substance | 46504655 |
| ChEBI | 9753 |
| PharmGKB | PA451799 |
| ChemSpider | 5389 |
| BindingDB | 50088494.0 |
| TTD | DAP001337 |
| Wikipedia | Troglitazone |
1. Chan et al. (2005)
2. Brunmair et al. (2004)
3. Vuda et al. (2016)
4. Rachek et al 2009